

The following series of articles is about my masters dissertation from the University of York, supervised by Dimitar Kazakov. The project spanned over four months, therefore the project had a very limited scope. Nonetheless, the aim of this study was to measure the impact of macroeconomic parameters and closing prices from other global markets when predicting the direction of the FTSE index. This study made use of feed-forward networks and an ensemble approach with the TensorFlow library.
This article will serve as a basic introduction by defining some basic concepts, particularly stock markets, stock market indices, market contagion, macroeconomics and microeconomics. It will also mention what sort of data was used in this study. Feel free to skip this article if you are already well versed in these topics.
Background and Data
Stock Markets
A stock is basically a share of a company. These stocks can be traded on what is called a stock exchange. Companies that are traded on a stock exchange are referred to as a listed company. As of June 2017, the stock exchange with the highest market capitalisation was the New York Stock Exchange (NYSE) at $21 trillion. These stock exchanges do not operate 24 hours a day and are closed throughout the weekend and bank holidays. The following table shows the opening and closing times for different stock exchanges from around the world. The price of a share at the end of the day is referred to as the closing price.

Stock Market Index
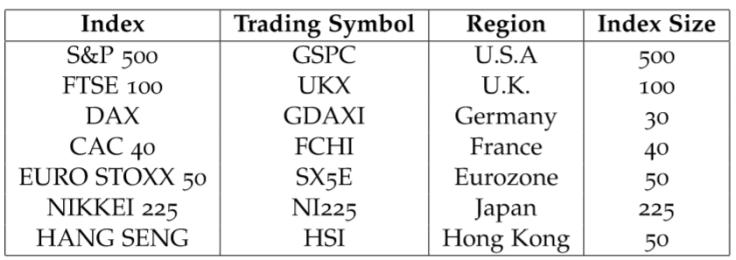
Another way to measure the value of a stock market, other than total market capitalisation, is to refer to what is called a stock market index. A stock market index is a weighted average computed from the most influential stocks in that market. For example, in the UK, the Financial Times Stock Exchange 100 (FTSE 100) is computed from the 100 companies listed on the London Stock Exchange with the highest market capitalisation, such as Tesco, BP, Barclays and Sky. Below is a table of the stock market indices used in this study, along with the region they represent and the number of companies in the index.
Market Contagion
One of the major shifts in the last few decades is globalisation, which consequently has increased openness and interpenetration of national economies and sovereign states. As a result, regional markets have started to be more correlated with each other, where market changes or disturbances spread from one regional market to another. This is referred to as market contagion. A good example is the Great Depression in the 1930s, which originated in the United States and resulted in the global GDP falling by 15% in the first 3 years. A more recent example is the financial crisis of 2008, the effects of which still linger on in some countries.
Macro and Micro Economics
Macroeconomics is the study of the behaviour, performance and trends of an economy as a whole. To keep the economy in check, governments look at macroeconomic factors such as gross domestic product (GDP) and inflation to aid them in economic policy decision making. Microeconomics, on the other hand, is the study of how individuals make economic decisions and their effect on the economy. These individuals are classified as consumers, producers and resource owners. These individuals interact with supply and demand for resources while using economic indicators, such as interest rates, as a pricing mechanism.
These two studies are deeply interlinked with each other since they contain overlapping issues. They can be considered as opposite approaches, where macroeconomics takes a top-down approach while microeconomics a bottom-up approach to analysing an economy. As an example of how interlinked these two studies are, it is evident that a stock market’s long-term performance is highly coupled with the economy’s performance. If the economy is doing well, then so should the financial outcome of companies. This coupled relationship can be seen in the following graph which shows a normalised plot for the U.S. GDP and S&P 500 stock market index.

Five macroeconomic parameters were chosen in this study. These parameters are widely used in describing the state of an economy. They are:
- Inflation
- The rate at which the general level of prices for goods and services is rising.
- If the price of milk costs £1 this year, with an inflation rate of 2% it will cost £1.02 next year.
- Deflation, which is the opposite, is much more catastrophic than high inflation because people will refrain from consuming goods because they know prices will be cheaper. This will drastically reduce the demand for goods, therefore this will result in corporate profit cuts, lower wages and reduce the workforce. Both consumers and producers must be willing to consume and produce.
- Balance of Trade
- The difference between the value of a country’s imports and exports during a certain period.
- If a country exports more than it imports, it will have a trade surplus, otherwise, it will have a trade deficit.
- GDP
- The total value of all goods and services produced in an economy.
- The bigger the GDP, the more goods and services are being produced, thus the healthier the economy.
- There are many factors that affect the GDP such as productivity, labour force size, life expectancy, unemployment rate, life expectancy and inflation.
- Unemployment Rate
- The percentage of the labour force that is jobless.
- In a weak economy, jobs tend to be scarce, hence the unemployment rate would be expected to rise.
- Interest Rate
- The percentage of the amount that one pays when borrowing, or gets paid when saving money.
- The bank rate, or base rate, is the most important interest rate in an economy and s set by the central bank.
- A high bank rate means that borrowing money will be more expensive, thus encouraging people to spend less, pay off their debt or benefit more from saving.
- It can be considered as a tool for monetary policy that can be used to contain inflation within an expected range.
Financial Forecasting
Financial forecasting is the ability to predict the financial outcome of companies, markets and economies. Stock market prediction is a subset of financial forecasting. While stock market prediction offers several high benefits through many commercial applications, it is a non-trivial problem because stock markets are dynamic, non-linear, complicated, non-parametric and chaotic in nature. One way to approach financial forecasting is to use machine learning.
Final Remarks
This concludes the first part of this series. The next article will go on to explain the experimentation process adopted for this study.

[…] is part two of my series of articles on my dissertation from the University of York. While the first article introduced the basic concepts required for this study, the second article describes the […]
LikeLike
[…] is the final part of my series of articles on my dissertation from the University of York. The first article introduced the basic concepts for this study while the second article described the experimentation […]
LikeLike